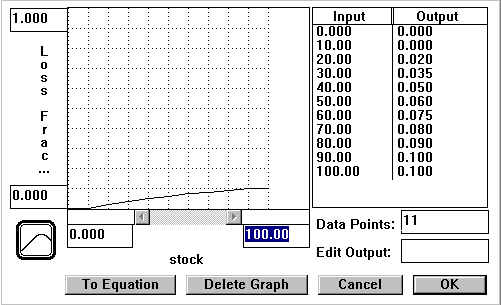
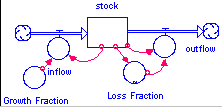
This model introduces another feature of STELLA, the ability to make a graphical function determine input. Values are based on how another resource (say a stock) is doing. This allows us to program in such features as growth until another resource, say food, reaches a critical threshold.
Hints: You want the growth fraction and
the loss fraction to eventually be the
same (equilibrium).
The independent variable is the stock.
Do not start the loss fraction at zero. This
will allow the initial exponential growth to
take place.
The components of this model:
1 stock
1 inflow
1 outflow
1 growth fraction (converter)
1 loss fraction (converter using graph)
Example values:
Stock = 5
growth fraction = .1
loss fraction = see diagram.

To cause a converter to become a graph:
Use a connector to go from the loss fraction to the outflow.
Use a connector to go from the stock to the loss fraction.
Double-click on the loss fraction. Select stock from required inputs.
Click on Become Graph.
Make the necessary changes either by using the
mouse to move the graph to your desired points
or by typing in the inputs in the table.
 To see what model looks like when run click here