Building a Savings Financial Model in Stella
SC '96
Prepared by John Biggerstaff
The problem:
The goal of this problem is to learn to build a simple financial model comparing different approaches to saving for retirement. This is a classical problem of when it is best to save. I like for you to build a model which would allow you to compare the life savings of two savers who have different approaches.
Sally will save $2,000 each year for the first 10 years that she works. She will then relax and let her investments accumulate through interest for the next 30 years for her retirement. She assumes that it is best to invest early.
Bob figures that he will earn more later and thus it will be
better to save then. He saves nothing the first 10 years.
He then saves $2,000 for each of the next 30 years and lets interest
go to work for him on those investments.
Model #1:
Assumptions:
All of the above.
Interest is a flat rate for the entire 40 years (7% for a beginning
value).
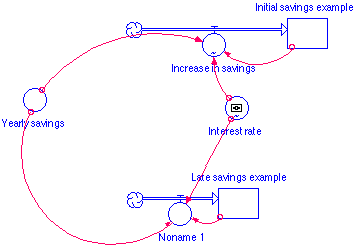
Pieces needed:
A stock for savings to accumulate in for each saver.
A flow for each stock that pumps savings into the stocks.
A converter in which we will store the interest rate.
A converter in which we will store the yearly investment.
Appropriate connectors.
Formulas needed:
An equation which determines how much new money will be pumped into each savers stock each year.
A logical (if..then) statement to determine when to apply the
yearly investment.
Top level graphical interface:
We want a graph that will help us to determine which saver comes out ahead at the end of the forty years.
We want a table that will indicate the exact amounts each saver will have for each year.
We would like to have an interactive slide bar at the top level
to allow us to modify the interest rate.
Use your model to examine:
Who has more at the end of the 40 years if the interest rate is 7%? 5% 6% 8%
At what interest rate will they end up with the same savings?
Do you suppose that the yearly investment makes any difference?
Financial Model 2:
This should be the same problem as number 1 with the exception
that we would like to use the actual interest rates for the past
40 years. I have included in the space below the average fed-funds
rate for each of the past 40 years. It isn't perfect as per
the interest rates but it is at least proportional to what the
savers would have achieved.
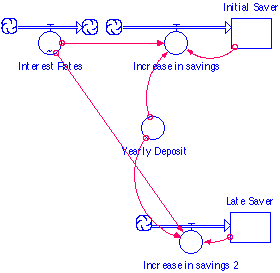
Changes needed:
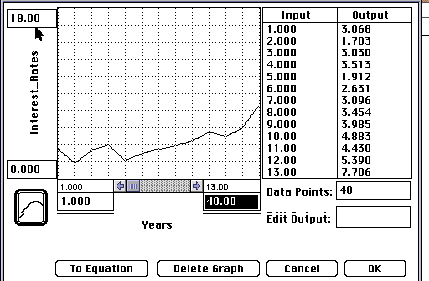
You will need to build a flow for the interest rate instead of
a converter. When you set its formula you will need to use
the variable "TIME". Once you have entered that variable,
click on the "become a graph" button. It will then
be necessary for you to enter the 40 values in the output column
and to insure that the TIME column follows the appropriate beginning
and ending values.
Examine:
What is the effect of this input of varying interest rates?
Try changing the graph of interest rates by predicting the future
and see what modifications in rates change the winner.
| 1 | 3.068 | 1957 | 21 | 5.248 | 1977 |
| 2 | 1.703 | 1958 | 22 | 7.371 | 1978 |
| 3 | 3.03 | 1959 | 23 | 10.597 | 1979 |
| 4 | 3.513 | 1960 | 24 | 12.707 | 1980 |
| 5 | 1.912 | 1961 | 25 | 17.134 | 1981 |
| 6 | 2.631 | 1962 | 26 | 12.886 | 1982 |
| 7 | 3.096 | 1963 | 27 | 9.032 | 1983 |
| 8 | 3.454 | 1964 | 28 | 10.308 | 1984 |
| 9 | 3.985 | 1965 | 29 | 8.225 | 1985 |
| 10 | 4.883 | 1966 | 30 | 7.086 | 1986 |
| 11 | 4.43 | 1967 | 31 | 6.615 | 1987 |
| 12 | 5.39 | 1968 | 32 | 7.264 | 1988 |
| 13 | 7.706 | 1969 | 33 | 9.226 | 1989 |
| 14 | 7.791 | 1970 | 34 | 8.256 | 1990 |
| 15 | 4.782 | 1971 | 35 | 6.178 | 1991 |
| 16 | 4.319 | 1972 | 36 | 3.791 | 1992 |
| 17 | 7.928 | 1973 | 37 | 3.025 | 1993 |
| 18 | 10.699 | 1974 | 38 | 3.805 | 1994 |
| 19 | 6.454 | 1975 | 39 | 5.782 | 1995 |
| 20 | 5.113 | 1976 | 40 | 5.365 | 1996 |
Model #1
Model #2
Table